2 main algorithms to help compress:
- K-Means Clustering
- Principal Component Analysis(PCA)
1. K-Means Clustering
1.1 import modules
    #show the figures buildin the notebook
    %matplotlib inline
    import numpy as np
    import matplotlib.pyplot as plt
    import scipy.io #Used to load the OCTAVE *.mat files
    import scipy.misc #Used to show matrix as an image
    from scipy import optimize
    import random
1.2 import sample data
    fileName = 'ex7/data/ex7data2.mat'
    mat = scipy.io.loadmat(fileName)
    X = mat['X']
1.3 find the closest for each sample
the algorithm as the following:
for i in xrange(iteration):
    idx = findClosedCentroids(X,centroids)
    centroids = computeMeans(X, idx, K)
    def findClosedCentroid(X, centroids):
        """
        return the indexs of the centroids for each sample in X
        """
        ids = np.zeros((X.shape[0],1)) * (-1)
        for i in xrange(X.shape[0]):
            ids[i] = findClosest(X[i],centroids)
        return ids

    def findClosest(point,centroids):
        """
        find the closest one in centroids array for the given sample
        return the index of the closed one
        """
        result = np.zeros((len(centroids),1))
        for i in xrange(len(centroids)):
            result[i] = distSquared(point, centroids[i])
        return np.argmin(result,axis=0)

    def distSquared(point1, point2):
        """
        return the distance of these 2 points
        """
        assert point1.shape == point2.shape
        return np.sum(np.square(point1 - point2))

    def computeCentroids(X, ids):
        """
        first, according the distinguish values in ids to get the value:K
        then, make good use of K to compute the K-centroids points(mean value)
        """
        k = len(np.unique(ids))

        result = np.empty((k,X.shape[1]))
        #print result.shape
        for i in xrange(k):
            result[i]=np.mean(X[ids.flatten()==i],axis=0)
        return result

    initial_centroids = np.array([[3,3],[6,2],[8,5]]);
    ids = findClosedCentroid(X,initial_centroids)
    centroids = computeCentroids(X,ids)
    print "the index for the init centroids:%s" % ids[0:3].flatten()
    print "the first centroids we compute by the init centroids is:%s" % centroids
the output is:
the index for the init centroids:[ 0. 2. 1.] the first centroids we compute by the init centroids is:[[ 2.42830111 3.15792418] [ 5.81350331 2.63365645] [ 7.11938687 3.6166844 ]]
    def calMeanK(X, centroids, maxIter=100):
        cent_history=[]
        for i in xrange(maxIter):
            cent_history.append(centroids)
            ids = findClosedCentroid(X,centroids)
            cent = computeCentroids(X,ids)
            if np.sum(cent!=centroids) == 0:
                break
            else:
                centroids = cent
        cent_history.append(cent)
        return ids,cent_history
    ids,cent_history=calMeanK(X,initial_centroids,100)
    print cent_history
The output is:
    [array([[3, 3],
           [6, 2],
           [8, 5]]), array([[ 2.42830111,  3.15792418],
           [ 5.81350331,  2.63365645],
           [ 7.11938687,  3.6166844 ]]), array([[ 2.31325526,  3.22830617],
           [ 5.33273768,  2.43159599],
           [ 6.8653618 ,  3.23293995]]), array([[ 2.19692479,  3.42136707],
           [ 4.83555397,  2.12976745],
           [ 6.6560054 ,  3.0751355 ]]), array([[ 1.98241171,  4.0250785 ],
           [ 3.91150763,  1.47060546],
           [ 6.34008592,  3.05366642]]), array([[ 1.95399466,  5.02557006],
           [ 3.12663743,  1.1121712 ],
           [ 6.12919526,  3.01606258]]), array([[ 1.95399466,  5.02557006],
           [ 3.04367119,  1.01541041],
           [ 6.03366736,  3.00052511]]), array([[ 1.95399466,  5.02557006],
           [ 3.04367119,  1.01541041],
           [ 6.03366736,  3.00052511]])]
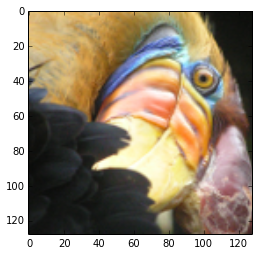
compress the image
load and display
    fileName = 'ex7/data/bird_small.png'
    A = scipy.misc.imread(fileName)
    print "the loaded image's data shape:",A.shape
    plt.figure()
    dummy = plt.imshow(A)
    plt.show()
the output is:
the loaded image’s data shape: (128, 128, 3)
normalization
    A = A / 255.0 # after the normalization, then the feature is in the range[0,1]
    print A.shape
    B = A.reshape((A.shape[0] * A.shape[1],3)) # can also use (-1,3)

    myK = 16 # use the 16 centroid point to stand for all the points in the image
    init_centroids = random.sample(B, myK)
    print init_centroids
the output is:
    (128, 128, 3)
    [array([ 0.47058824,  0.31764706,  0.21568627]), array([ 0.89803922,  0.76470588,  0.4745098 ]), array([ 0.57254902,  0.50196078,  0.17647059]), array([ 0.09411765,  0.10980392,  0.12156863]), array([ 0.06666667,  0.07058824,  0.05882353]), array([ 0.84313725,  0.69019608,  0.39215686]), array([ 0.69019608,  0.54901961,  0.56862745]), array([ 0.36078431,  0.22745098,  0.21960784]), array([ 0.43921569,  0.3254902 ,  0.33333333]), array([ 0.23529412,  0.21960784,  0.21568627]), array([ 0.76470588,  0.6745098 ,  0.41176471]), array([ 0.99607843,  0.95294118,  0.74509804]), array([ 0.11764706,  0.1254902 ,  0.1254902 ]), array([ 0.85882353,  0.76078431,  0.52941176]), array([ 0.92156863,  0.86666667,  0.5254902 ]), array([ 0.82745098,  0.70196078,  0.45490196])]
cal the centroids
    idxs, centroid_history = calMeanK(B,init_centroids,10)
    print idxs
    [[  1.]
     [  1.]
     [  1.]
     ...,
     [  9.]
     [ 12.]
     [ 12.]]
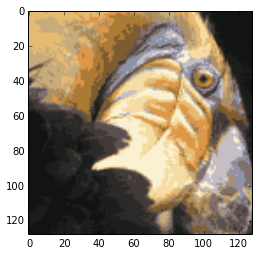
compress and display
    final_cent = centroid_history[-1]
    cover_A = np.array([final_cent[int(i)] for i in idxs.flatten()])
    cover_B = cover_A.reshape(A.shape)
    plt.figure()
    plt.imshow(cover_B)
    plt.show()