Overview
Implement Linear Regression Using IPython notebook
import the necessary python libs
%matplotlib inline
import numpy as np
import matplotlib.pyplot as plt
Load the data into ndarray of Numpy
# using numpy to load data as Array
datafile = 'ex1/data/ex1data1.txt'
cols = np.loadtxt(datafile,delimiter=',',usecols=(0,1),unpack=True)
print np.shape(cols)
X = cols[:-1].T # X is the samples data
Y = cols[-1:].T # Y is the samples label
(2, 97)
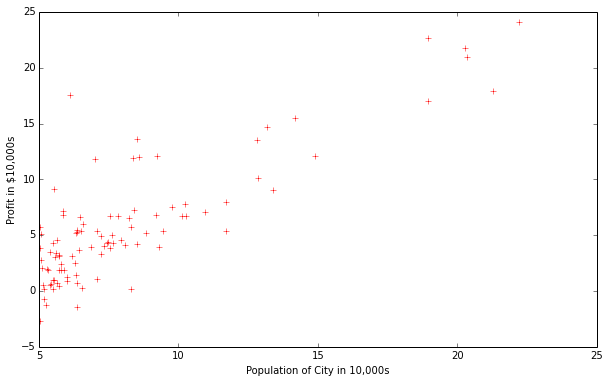
# 这是一个X=(97,1), Y = (97,1)的测试数据,我们可以使用一个二维图进行展示
plt.figure(figsize=(10,6))
plt.plot(X,Y,'r+',label='sample')
plt.ylabel('Profit in $10,000s')
plt.xlabel('Population of City in 10,000s')
plt.show()
iteration = 150 #循环150次
alpha = 0.01 #learning rate = 0.01
# 定义hypothesis
'''
X:
X[i]:表示第i条样本数据
theta:是个参数向量
'''
def h(X, theta):
return np.dot(X, theta)
# 计算误差值
def costFunction(X,Y, theta):
A = h(X, theta) - Y
m = Y.size
return float(1.0/(2*m)) * np.sum(np.dot(A.T,A))
X = np.insert(X,0,1,axis=1)
init_theta = np.zeros((X.shape[1],1))
print costFunction(X,Y,init_theta)
32.0727338775
def gradientDescent(X, Y, theta, iteration = 50, alpha = 1.0):
hist_theta = [] # used to store the theta for every iteration
ce = [] # cost error
for it in xrange(iteration):
hist_theta.append(list(theta[:,0])) # save the current theta
ce.append(costFunction(X,Y, theta))
theta = theta - alpha/len(Y) * np.dot(X.T,(h(X,theta) - Y))
return hist_theta, ce, theta
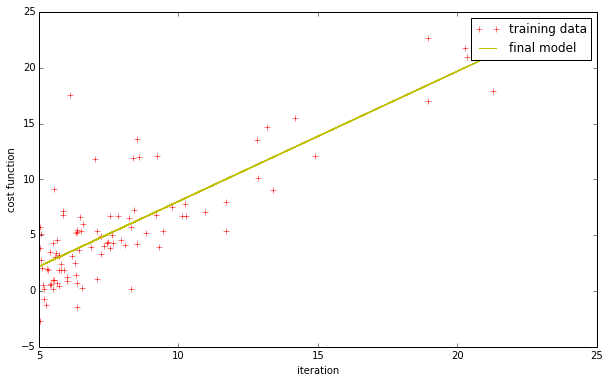
hist_theta, ce, theta = gradientDescent(X, Y, init_theta, iteration=1500, alpha=0.01)
print theta
[[-3.63029144]
[ 1.16636235]]
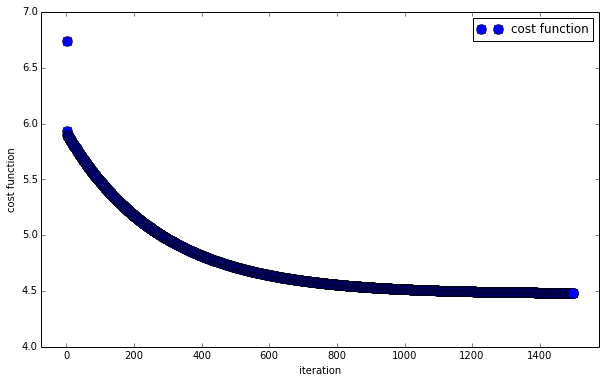
展示成本函数随着循环次数的变化
plt.figure(figsize=(10,6))
plt.plot(X[:,1],Y[:,0],'r+',label='training data')
plt.xlabel('iteration')
plt.ylabel('cost function')
plt.plot(X[:,1],h(X,theta),'y-',markersize=10,label='final model')
plt.legend()


<matplotlib.legend.Legend at 0x7f83554385d0>
plt.figure(figsize=(10,6))
plt.plot(range(len(ce)), ce, 'bo', markersize=10, label='cost function')
plt.xlabel('iteration')
plt.ylabel('cost function')
plt.xlim((-0.05*len(ce),1.05*len(ce)))
plt.ylim((4,7))
plt.legend()


<matplotlib.legend.Legend at 0x7f83558743d0>